
Why the UK needs road pricing, and how to introduce it in a way that delivers social, public health and environmental benefits for all.
This is an updated version of evidence submitted to the House of Commons Transport Committee’s 2021/22 inquiry into road pricing
Executive Summary
There is an urgent need to put in place mechanisms to:
- Replace lost revenue from duty and VAT on fuel as petrol and diesel vehicles are replaced with electric versions at an accelerating pace.
- Fund the provision of more comprehensive and dependable public transport, in particular bus services, to provide a viable alternative to owning and driving a car for much more of the country’s population.
- Incentivise modal shift from solo-occupancy cars to active, public and shared transport.
- Incentivise more efficient movement of freight, in particular ‘first-mile’ collections and ‘last-mile’ deliveries.
The revenue from duty is equivalent to seven percentage points on the basic rate of Income Tax. Loading it onto electricity would ultimately increase the unit cost by at least 35%, which would cause severe hardship for a significant proportion of society. Increasing Vehicle Excise Duty would unfairly penalise low-mileage drivers. Various forms of tolling and congestion charging require heavy investment in infrastructure and typically create perverse incentives. For instance, a daily congestion charge is like paying for an all-you-can-eat buffet.
The only way to achieve all four objectives is to introduce road pricing that is sensitive to external costs (such as carbon emissions, pollution and congestion) and directly connected to the provision of alternative active and public transport options.
Road pricing faces political challenges to introduce a new tax and protect personal privacy; and an organisational challenge to set up a national tracking and billing system.
Proposed here is a ‘National Road User Charge’ or NRUC that starts as a simple, distance-based replacement for fuel duty. Further development will require a co-ordinated programme of public information campaigns and deliberative democracy to develop clear narratives and consensus around roads as a national utility, and the need to respond effectively to environmental and public health crises.
Ideas for how NRUC might develop are also presented, including how a proportion of the charge could be hypothecated to national and regional transport authorities to fund road management and maintenance costs, subsidies for public transport, and other investments in sustainable and socially desirable transport measures.
Personal privacy would be protected by using third parties, such as vehicle insurers and manufacturers, chosen by vehicle owners to mediate their data. This would ensure government has access to only as much personal information as it needs for audit and statistical purposes.
Contents
Available revenue-raising tools
Obstacles to introducing road pricing
Challenges
The following challenges provide strong motivations for redesigning how the use of motor vehicles is taxed.
Decarbonisation
The Paris Agreement[1] and Climate Change Act[2] recognise the urgent need to reduce emissions of greenhouse gases (principally carbon dioxide and methane). Although there is a tendency to talk about ‘net zero’ as a target in a particular year (2050 in the case of the UK), this is largely irrelevant to what is actually driving climate change, which is cumulative emissions – the sum of annual emissions that accumulate in the atmosphere. This gives rise to the concept of a total carbon budget, from which each country draws down each year.
According to climate modelling by the Intergovernmental Panel on Climate Change (IPCC),[3] the world has a carbon budget for cumulative emissions from 2020 of 495 gigatonnes of CO2e in order to have a 50% chance of limiting the average global temperature rise to 1.5°C.[4] Warming beyond that is likely to trigger irreversible, runaway ecosystem changes that will make much of the inhabited world uninhabitable, especially coastal regions and low-lying islands.
Road transport accounts for 24.3% of the UK’s annual carbon emissions, and 21.5% of domestic energy consumption. If consumption/losses by the fossil fuel energy industry are excluded, narrowing the focus to productive energy consumption, road transport accounts for 30.8% of emissions and 28.8% of energy consumption.[5]
Pro-rata by population, the carbon budget for the UK would be 4,300 MtCO2e, and for UK road transport, around 1,000 MtCO2e. Annual emissions from road transport are currently running at 110.7 MtCO2e/year.5 Without drastic action, the carbon budget will be exhausted before 2030. To have a reasonable chance of staying within budget, emissions in 2030 must be less than half those in 2010.
It is therefore hugely important for the UK to implement policies to reduce carbon emissions from transport rapidly. As other sectors, such as steel and cement production, space-heating and air travel are even more challenging to decarbonise than road transport, government policy should be to decarbonise transport more quickly than other sectors.
Electrification of road transport alone will not reduce total emissions significantly in the short term, as any ‘green’ electricity consumed by transport is not available for existing or future uses, such as powering heat pumps. Until all energy demand can be met by zero-carbon generation, the only way to de-carbonise energy consumption is to reduce it. For road transport, that means reducing vehicle-miles, as there are only marginal gains left to be made in vehicle efficiencies.
Halving the UK’s transport emissions by 2030 therefore entails a roughly 50% reduction in vehicle-miles. Allowing other sectors more time to adapt requires an even larger reduction in vehicle-miles.
Reducing vehicle-miles without reducing economic productivity requires:
- Modal shift from cars to walking, cycling and other micromobility modes
- Modal shift from cars to public transport
- Ride-sharing to increase car-occupancy rates
- Remote-working from home and co-working hubs
- Video-calling/conferencing instead of (some) in-person meetings
- Consolidation of freight movements to increase vehicle loading and reduce empty-running
- First/last mile logistics completed using smaller, electric and human-powered vehicles
The shift to electric vehicles
As all-electric vehicles become price-competitive with petrol/diesel vehicles on an annualised whole-life cost basis, people will increasingly choose to buy EVs. The tipping point for sales of electric cars is likely to be reached within a few years. It will then be only a few more years before almost all new cars sold are electric.
This is likely to follow a similar pattern to digital camera sales,[6] which replaced film camera sales in just six years from the tipping point in 1999. In Norway the proportion of electric cars as a proportion of all sales grew from 37% in January 2017[7] to 54% in 2020.[8]
Concern about the effect on public health of vehicle pollution is pushing governments to ban diesel vehicles completely in urban areas (Paris, Madrid, Athens and Mexico City have already set 2025 as their deadlines[9]) and to consider scrappage schemes. These measures will further accelerate the transition to electric vehicles.
The transition may, however, be slowed by lack of charging infrastructure for cars parked on-street. Although in theory charging points could be integrated into lampposts, most lampposts are not in usable locations (e.g. set back from the kerb, or where a parked car would cause an obstruction).
Loss of tax revenue
HM Treasury stands to lose at least £31.5 million of annual revenue at an accelerating pace as the transition to EVs passes a tipping point. Fuel duty raised £27.2 billion for the Treasury in 2019. VAT on fuel (which also applies to duty) raised about another £10.1 billion, of which about £3.7 billion was returned to VAT-registered businesses, making a net revenue of around £33.5 billion.[10]
One litre of petrol is replaced by about 3 kWh of electricity, and one litre of diesel, by about 3.5 kWh.[11] So, we can also calculate the net tax revenue from electricity. The Climate Change Levy (at 0.775p/kWh) would raise about £1.1 billion, and VAT a further £1.1 billion (based on the 2020 average standard rate of 17.2p/kWh inc VAT), of which £0.4 billion would be returned to VAT-registered businesses.10
So, the current £33.5 billion revenue would be replaced by just £1.8 billion, a net loss of £31.8 billion.
If most EV charging is done overnight at a lower rate (e.g. 10p/kWh inc VAT for Economy 7) and some off-grid (e.g. at no cost from rooftop solar panels), the tax revenue from electricity would be even lower, widening the fiscal gap yet further. There would also be a loss of VAT revenue from vehicle servicing and maintenance, as electric vehicles have fewer moving parts, no need for regular oil changes or vehicle emissions tests.
Rebound effect from lower marginal cost of driving
Including VAT, one litre of petrol costing £1.25 is roughly equivalent to 3 kWh of EV charging, costing £0.52 at an average standard unit rate, or £0.30 at an average Economy 7 rate.[12] Someone who switches to an EV and is able to recharge it overnight, will halve or even quarter their per-mile cost. If they can recharge the car from their own solar panels, then the cost per mile will approach zero.
There have been few studies of behaviour changes when switching from a petrol/diesel vehicle to an electric, and most of these have been of hybrid not battery-electric. Until there is wider adoption of EVs, it will not be possible to determine what the longer-term effects may be.
However, basic economic theory would suggest some increase in mileage is inevitable, and a large increase highly possible. Established figures for the elasticity of the relationship between price and vehicle-miles are typically based on studies of small percentage changes in price, which cannot be extrapolated reliably to a percentage change as large or larger than 50%.
Furthermore, the way that people will pay to recharge their vehicles will be psychologically very different to paying for fuel at a garage. Most charging will be at home or work premises, where the cost will be incorporated into a larger bill, paid at another time. On-site generation and variable-rate electricity tariffs16 will further obscure the connection between consumption and cost.
It is likely that the annual mileage of EVs is currently constrained by the single-charge range and, perhaps more pertinently, range anxiety – the fear of not being able to find a recharging point before the battery runs flat. As battery capacity increases (because of technological and manufacturing advances), the single-charge range of an EV will become less and less of a constraint. Furthermore, as more rapid-chargers are installed around the country, range will cease to be a constraint. Even though the cost per mile is higher when recharging from a public charge point (ecotricity charges £0.30p/kWh,[13] making the cost-equivalent of a litre of petrol £0.90), it is still cheaper than petrol or diesel. We are therefore likely to see an increase in vehicle-miles as EV adoption accelerates.
Increased demand for electricity
The shift to electric vehicles will lead to an increase in demand for electricity. In energy terms, the increase will be in the region of two thirds (236 TWh on top of 346 TWh consumed now).[14] Generating capacity to meet peak demand will not increase by anything like as much as that, since most charging will be at off-peak times. This is because vehicle owners can avail themselves of lower rates (e.g. Economy 7) if they recharge overnight. Smart Grid technology (see below) will automate this.
It should be noted that, until all electricity demand can be met by zero-carbon generation, any increase in consumption can only be met in the short run by increased output from fossil fuel generators. As vehicles, heating and industrial processes increasingly use electricity instead of oil and gas, demand will continue to exceed the available supply of zero-carbon (nuclear, wind, solar and hydro) generation. At least initially therefore, the replacement energy source is fossil-fuel sourced electricity, and the reduction in carbon emissions will be minimal.
The transition to electrification is necessary for decarbonisation in the long run, but in the short run it contributes little benefit. It is for this reason that reducing energy consumption in the short run is unavoidable if the country is to keep within its carbon budget while the energy sector transitions to zero-carbon generation.
Still, some charging during the day will be needed. For some applications, in particular long-distance haulage and public transport, it’s not cost-effective to carry a full day’s charge as there is a trade-off between range and the weight of batteries (which themselves require energy to be moved). Recharging at times of peak general demand will require additional generating and/or storage capacity as well as reinforcement of local distribution networks.
Until all energy consumption can be met by net-zero-carbon sources (renewables, nuclear and carbon-captured combustion), any increase in demand can only be met by increasing output from conventional fossil fuel plants – principally, in the UK, gas turbine generators. So, there is a carbon cost to increasing peak demand.
Peaks in demand can be smoothed to some extent using local energy storage, such as vanadium flow/redox, compressed air, pumped liquid storage.[15] These would be recharged from the grid during off-peak periods, and may play in important role at freight depots, bus stations, motorway service stations, and business and retail car parks.
In summary, there will need to be investment in:
- Additional generating capacity
- Grid (electricity distribution network) reinforcement
- Local energy storage
- Smart Grid control systems
All of these have both capital and recurring cost elements, which will need to be covered by a mixture of public and private money, which will ultimately feed through to increased electricity costs and/or higher general taxation.
Smart Grid
Smart Grid technologies enable dynamic regulation of demand to better match available supply, in particular of zero- and low-carbon electricity sources. At the moment, some large business consumers have contracts that permit their energy supplier to, in effect, remotely turn off appliances. Smart Grid technology would extend this to more consumers, ultimately including all homes. That will mean vehicle charging can be controlled remotely so that demand is shifted from times of peak domestic demand (e.g. early evening) to the night time.
The benefits are twofold: the required installed capacity to meet peak demand is reduced, and renewable generation is not wasted. The first part implies that generating capacity is used more efficiently, so the return on capital is higher and electricity will (in a well-functioning market) be cheaper. The second part will become relevant as wind generation starts to exceed troughs in demand. The Smart Grid will be able to schedule non-time-critical consumption, such as overnight vehicle charging, to coincide with times of high renewable generation.
Smart Grid demand management also extends to regulating stored energy, which includes vehicle batteries. Vehicle-to-grid supply could become an important way to meet peak demand. In other words, vehicles connected to a charger at 5pm for an overnight charge could be partially discharged up to 7pm to meet peak domestic demand, then charged later in the night ready for use in the morning.
Smart Grid objectives may in theory be achieved by varying electricity prices by time of day, and programming appliances to respond to price signals. Some customers are already on such tariffs, actively managing their consumption and battery storage on the basis of half-hourly price signals.[16] A number of questions remain:
- There may be no inconvenience in deferring when the car is charged, but is it reasonable that a family should pay more to cook their children’s dinner?
- If more than one price is needed, how will consumption be segregated and metered for different uses?
- How will this be rolled out at scale in a reasonable time frame?
It should be noted that the roll-out of electricity Smart Meters has been dogged by delays and technical problems. After more than eight years, still only 35% of meters are smart (“operating in smart mode”).[17] Communication of forward price signals is not yet available as part smart metering, and the technology to programme appliances to respond to dynamic pricing is still in its infancy.
External costs
Road traffic casualties have a direct cost of £8.3 billion/year.[18] There is also a subjective human cost of living with a disability caused by a collision or the loss of a family member, estimated at £21.2 billion/year.18 Air pollution from burning fossil fuels and particulates from tyre and break wear are estimated to cost the NHS £6 billion/year.[19] Physical inactivity, partly owing to overreliance on driving, is estimated to cost a further £0.5 billion.19 Carbon emissions account for at least another £8.1 billion/year (based on a carbon price of £69/tonne19).
These costs alone total over £48.1 billion/year. Vehicle-based taxes net about £40.5 billion/year.[20] Government expenditure on roads of around £10.1 billion[21] leaves a net revenue of £30.4 billion, leaving a shortfall of at least £17.7 billion.
Contrary to popular understanding, vehicle owners do not cover the full costs of driving. There is a large social cost, principally the impacts of carbon emissions and collisions, that is not priced in. A large part of this cost falls on those who walk and cycle, who are at greatest risk of serious injury or death in a collision with a motor vehicle. The cost of public transport also does not reflect its greater safety and lower carbon emissions per passenger-km.
Unwittingly, society is subsidising private transport at the expense of active and public transport.
App-based and driverless taxi services
In cities where app-based taxi services, like Uber and Lyft, operate, there has been an increase in total vehicle-mileage as passengers are drawn away from buses (as well as from private cars and hackneys) and people make more journeys. Analysis of vehicle data in New York City indicates that rapid growth in use of app-based taxi services since 2013 had led to a 7% increase in traffic on the most congested streets in Manhattan[22], and a 4% decline in bus ridership[23] (before 2013, bus ridership had been growing). A later study found an 8.9% decline in public transport ridership.[24]
If and when they reach maturity, autonomous taxis will compete even more effectively on price with public transport, offering a faster, door-to-door service at a lower price than chauffeured taxis. That is likely to lead to a (further) significant reduction in public-transport patronage, undermining its viability. In urban areas this could lead to a proliferation of congestion, as even two-seater ‘pods’ are less space-efficient than trains, trams and buses. It will be difficult to reverse this vicious cycle once started, because increased congestion will make buses and street-running trams even less attractive.
Available revenue-raising tools
Fuel Duty
Increasing fuel duty would affect only drivers of petrol/diesel vehicles. It would provide some additional incentive for people to switch to electric vehicles, but would not address the longer-term problem of the fiscal gap created by people no longer paying fuel duty and VAT on petrol and diesel.
In any case, the government has not increased fuel duty since 2011, when it instituted the Fair Fuel Duty Stabiliser, to limit fuel duty rises when the international oil price rises above £45 a barrel.[25] The equity arguments against increasing fuel duty will grow stronger as take-up of EVs accelerates among wealthier and higher-income individuals.
Tax on electricity
As shown earlier, the likely revenue from VAT on electricity to charge EVs is under £1 billion. Raising taxes on electricity to yield the £33.5 billion raised from fuel duty and VAT on fuel would be a contentious move, even if phased in gradually.
It would deter people from making the transition to electric vehicles and heating, which are essential components of a decarbonisation strategy. Any delay is likely to result in an increase in cumulative carbon emissions and more deaths from air pollution.
Concerns relating to social equity could take years to resolve satisfactorily – if ever. In the meantime, the number of EV owners will grow, and they will become a powerful lobby group against increases in electricity prices.
From a transport perspective, a tax that cannot incentivise when and where people drive is of limited use in regulating congestion and air pollution. Transport planners need to be able to improve the speed and reliability of buses and road-running trams in order to incentivise modal shift away from driving. In built-up areas, the scope for building bus lanes is limited, and often at the expense of high-quality infrastructure for walking and cycling, trees and green space, needed for biodiversity, flood-control and shade. Reducing peak traffic flows is often the only way, and certainly the most cost-effective way, to improve public transport.
If tax on electricity were to be raised, these are some options:
Replace VAT on electricity with a universal levy
VAT is reclaimable by businesses, reducing the gross revenue if all road transport were electric by about 38%.[26] By contrast, the Climate Change Levy[27] is not reclaimable. If the latter replaced VAT at 5%, net revenue would increase by about 60%. It would still be less than £2 billion.
Increase the Climate Change Levy on electricity
If all existing vehicle mileage were by electric vehicles, electricity demand would increase from 346 to 582 TWh/year.26 If the Climate Change Levy were to net the same revenue as VAT on electricity plus duty and VAT on petrol/diesel, the rate would need to increase from 0.775p/kWh to 5.8p/kWh.27 This would increase the average standard rate (16.4p/kWh ex VAT) by 30.5%, and the average Economy 7 rate (9.5p/kWh) by 52.5%. 27
Increasing taxation of electricity would disproportionately hurt the poorest in society, who already struggle to afford the basic essentials, including electricity to power the home. It would also slow the rate of uptake of EVs and heat pumps, both of which are essential elements of credible strategies to reduce emissions of carbon and air pollutants. Neither outcome is compatible with government policies on social welfare, public health and decarbonisation.
There are two ways this may be mitigated: tier the levy with consumption and/or segregate levy rates by consumption. In both cases the increased levy would need to be phased in gradually to give people and businesses time to adapt.
Tier the Climate Change Levy
The impact of an increased levy might be made more equitable by zero-rating the levy for the first so many units consumed annually, with the levy increasing in steps with consumption. The challenge would be to set the thresholds and scope equitably. As energy is charged for at the level of homes and businesses, this is not straightforward.
Households vary hugely in their ‘essential’ consumption of electricity, depending on the number of occupants, the size and age of the building, the type of heating system installed (e.g. storage heaters or a heat pump versus a gas boiler), and whether there is on-site generation (e.g. rooftop solar panels or a combined heat-and-power boiler).
Would an EV mileage allowance be included? If it applied to households that do not have an EV, would it incentivise them to consume energy wastefully for other uses? Would the allowance vary depending on circumstances (e.g. living in a remote rural location or being car-dependent owing to disability)?
It would require a complex and administratively demanding system to assess and reassess a fair zero-rate band on a case-by-case basis. Also, should any business, public sector, charitable or other bodies also be entitled to a zero-rate band? How would that be set?
Vary the Climate Change Levy by use
A more technical solution could be to meter EV charging separately to general consumption and apply different levies, possibly tiered in each case. Since a car may be slow-charged from an ordinary 13-amp socket, this would require a protocol to be built into the vehicle charging system to accept charge only from a metered supply. This could be part of specifications for the Smart Grid (see above).
However, such a move is likely to be met by considerable resistance from both consumers and vehicle manufacturers. For people to be receptive to Smart Grid technology, they will need to see positive benefits. Being charged more tax is not perceived as a benefit. Conflating the objectives of tax raising with demand management would undermine the latter, resulting in electricity demand having to be met by fossil fuels further into the future, increasing cumulative carbon emissions.
Tax on hydrogen
Although hydrogen may find a niche in fuelling HGVs, buses and trains, these operate in sectors where any additional taxation may have a net negative impact on economic activity (in the case of freight haulage) and social benefit (in the case of public transport). Therefore, although the opportunity exists to tax hydrogen, it is unlikely to be a major source of revenue to the Treasury.
Vehicle Excise Duty (VED)
VED raises £5.9 billion for the Treasury. VED is a useful lever for incentivising car buyers to choose lower-polluting vehicles. However, since it is a flat fee unrelated to vehicle usage, it cannot incentivise changes to driver behaviour. Increasing VED significantly would disproportionately and unfairly hit low-mileage drivers who require a car – perhaps because they live in an isolated location or have caring responsibilities.
An increase in VED might be justifiable where people have access to transport alternatives, in particular in urban areas. Although this would create an incentive to register the car in a lower-cost location (e.g. a second home or that of another family member), this is something vehicle insurers already have to guard against.
It may be more equitable than increasing the cost of residents’ parking permits, which do not apply to those who can afford a house with off-street parking, but who nevertheless contribute to local congestion and pollution.
Road tolls
Road tolls are commonplace on motorways in many countries, from France to China. In the US, tollways typically compete with freeways, offering a faster or shorter journey (similar to the M6 Toll road).
Modern implementations employ automatic number plate recognition (ANPR) cameras rather than tollbooths. This reduces hold-ups for drivers. However, the running costs of both are relatively high: tollbooths require staff and maintenance of equipment; automated tolling requires a back office to manage user accounts, reconcile payments, enforce non-payments, and investigate disputes. A particularly costly overhead is debt collection from overseas drivers: the Dartford crossing reported in an FOI request[28] that 2% of all crossings by vehicles registered overseas were unpaid during December 2014.
Tolls are generally cost-effective for tunnels and bridges because the alternative route is very much less convenient. (An exception is the Humber Bridge, which ultimately required £150 million debt write-off.) Tolling was rejected for a section of the A14 in part because the impact of traffic using local roads to avoid the toll would most likely have been intolerable for local communities. The public consultation concluded that “tolling is almost universally unpopular.”[29]
The M6 Toll is underused. The Highways England 2015 traffic count[30] just north of Royal Sutton Coldfield recorded 47,176 vehicles per day (averaged over 2015), whereas the M6 at Castle Bromwich carried 134,457 vehicles per day. Assuming the toll is already set at the ‘sweet spot’ to maximise revenue to Midland Expressway Ltd, the only way currently to increase usage would be for Government to subsidise the toll. There would be a welfare-economic argument in favour of doing this as it would yield time savings for new users of the M6 Toll and remaining users of the M6.
Congestion charge (daily fee)
Most existing congestion charges require payment of a fixed fee to enter, and in most cases, move around in, a controlled zone for a fixed period (typically a calendar day). In the UK only London (£15/day[31]) and Durham (£2/day[32]) have congestion charging. London’s charge is supplemented by a ULEZ charge[33] for higher-emissions vehicles of £12.50/day or, for HGVs, £100/day. Other cities have considered but rejected a congestion charge: Manchester and Edinburgh, in referendums; Cambridge, in a political change of heart.
One major problem with a daily charge is that the incentive is binary: either don’t drive today or drive as much as you like. It is effective at deterring many residents from driving into the congestion charge zone; but anyone who accepts the charge (personally or for a business) has no incentive to minimise the distance they drive.
Paying the charge can be interpreted as buying the right to drive, leading to an expectation of priority over people walking or cycling (“I’ve paid to use this road!”). This argument is already used frequently by road users to claim priority over people cycling or walking, who haven’t paid “road tax” (which may be interpreted as shorthand for Vehicle Excise Duty and fuel taxes).
Congestion charge (control points)
It is possible to make congestion charging less binary by charging vehicles as they pass through control points. These may form a cordon (as they do in Stockholm and Gothenburg, Sweden) or be distributed around a city (as in Singapore). The fee charged may vary during the course of a day, creating an incentive not to drive in peak hours.
The fee in Stockholm[34] varies by time of day between 11kr (≈£1) and 45kr (≈£4) and is the same at every control point except the Essingeleden motorway. The maximum daily charge is 135kr (≈£12).
The fee in Singapore[35] varies by both time of day and location. Pre-COVID, the fee could be up to S$6 (£3.40), but is more typically S$0.50 (£0.28) or S$1 (£0.56). Fees are reviewed regularly. Traffic in Singapore is still below the level it was in 1975, before a congestion charge (“Area Licensing Scheme”) was first introduced.
Both of these systems are effective in their respective cities, but they depend on a considerable amount of infrastructure in the form of cameras, communication systems and, in the case of Singapore, in-vehicle transponders with payment card readers. To install infrastructure like this across the whole of the UK would be hugely expensive and time-consuming.
Road pricing
Road pricing has been on the agenda for over sixty years, at least since the Smeed Report[36] published in 1964. It treats roads like a utility, such as water or electricity, consumed on a pay-as-you-go basis.
At a minimum, it can be based on a regular record of mileage driven – equivalent to utility meter readings. A charge is calculated by multiplying the mileage driven by a per-mile rate determined by certain fixed characteristics of the vehicle, such as carbon emissions, fuel economy and weight. As such, it would apply in a similar way to fuel duty.
If not only miles, but vehicle time and location are tracked, then the per-mile rate may vary. A higher rate may be applied when and where roads are heavily congested and on infrastructure that is currently tolled. A lower rate may be applied on isolated rural roads. This allows external costs, such as carbon emissions, pollution and congestion, to be reflected in the charge, and for rural communities to receive fairer treatment.
With location information, it becomes possible to hypothecate a portion of the charge to the appropriate national or regional transport or highway authority. This could create a fair and reliable funding stream for transport and highway authorities to cover road lighting, policing, management, maintenance and renewal.
One factor determining the charge could be the availability of alternative local transport options. If that also determined the proportion hypothecated to the local transport authority, it would create a double incentive: local authorities would, in effect, receive a return on any investment in active and public transport; car drivers would be incentivised to mode-shift from driving to the new alternatives. This overcomes the chicken-and-egg debate, in which local residents resist demand-management measures because the alternatives to driving are inadequate; but local authorities have insufficient resources with which to improve the alternatives.
Singapore is currently planning the next generation[37] of its congestion charge system, using in-car GNSS[38] receivers to charge based on distance driven, time of day and location. This should be studied as a pilot for a future UK road pricing scheme.
Oregon, USA, has a voluntary mileage-based system, OReGO,[39] which charges 1.8 cents/mile. Owners of petrol/diesel vehicles receive a rebate of State Fuel Tax paid, which can exceed what they pay for the road usage charge. Owners of electric vehicles save on the annual registration fee ($97), which more than offsets the per-mile charge if they drive less than 5,388 miles/year. For those who drive more, the state argues that participation will ensure Oregon roads are properly maintained, reducing vehicle repair costs:
If all electric vehicle owners paid a road usage charge, funding for road maintenance would increase, and vehicle costs related to bad roads could be reduced.[40]
How persuasive people find this argument is currently unclear.
Germany has, since 2005, charged HGVs a mileage-based toll on motorways and, since 2015, all ‘A’ roads. The toll rates are set by government, under the terms of the German Federal Trunk Road Toll Act, and vary by emissions rating and weight from 0.093 to 0.261 € per km.[41] The scheme is administered by a private company that specialises in road user charging.[42]
Obstacles to introducing road pricing
Public attitudes
It is human nature for people to resist something that will cause them loss of wealth, privilege, comfort or agency. Even when there is a corresponding benefit, the painful anticipation of loss is felt more acutely than the pleasurable anticipation of gain.
Road pricing triggers every one of these loss-aversions: people fear it will cost them more; that they will lose social status and comfort if they walk, cycle, or sit or stand on public transport; and that the choice to make this change will be forced upon them.
Fortunately, humans are social creatures, prepared to make and accept changes that go against their perceived best interests. This can be because they respect a majority view; or because they derive a sense of meaning in being part of a collective endeavour; or because they are pulled along or shamed by peer pressure; or because they feel altruistically towards others who will benefit from their loss.
But the path to acceptance is difficult. It requires, at a minimum, honest and respectful communication; empathetic engagement; and transparent and inclusive decision-making.
An Ipsos MORI poll in December 2020 “found six in ten Britons supporting the introduction of schemes involving charging motorists a fee for driving in and around towns and city centres if they are designed to reduce traffic congestion and improve the local environment e.g. by reducing emissions, or to raise revenue to invest in transport. This has not always been the case; a survey [Ipsos MORI] did in 2007 using the exact same question found higher levels of opposition than support.” [43]
As this shows, attitudes to road pricing have shifted significantly in recent years, in large part because of greater awareness and concern for the health impacts of air pollution. This is reflected in how people responded to the Ipsos MORI poll when the question referred explicitly to air quality: “while a fifth, 21%, oppose schemes in principle, this drops to 15% if charges are higher for more polluting vehicles and just 14% if schemes are used to improve air quality.” 43
The conclusion of the survey report summarises the position well:
Road pricing might be inevitable, but if it is to avoid becoming a “poll tax on wheels”, it needs to make sense to the public emotionally as well as rationally. That means solving more than a Treasury problem; it means delivering tangible social benefits as well as fiscal ones.” 43
Monitoring infrastructure and billing systems
Specifying, commissioning, installing and testing infrastructure to monitor all vehicle movements will take several years. We no longer have that much time to implement road pricing: the tipping point for sales of electric vehicles will be within the next few years; climate, ecological and public health crises are already upon us. The only way to introduce road pricing quickly is to start with the minimum of infrastructure.
To avoid the cost of developing a completely new billing system, there would be less risk in working with companies that have an existing relationship with vehicle owners, such as insurers and manufacturers. If government focuses on defining standards, specifications and drawing up necessary legislation, the private sector can develop the required back-end systems.
Objectives
In designing a solution, these four policy objectives must be satisfied:
1. Replace fuel duty revenue lost as electric vehicles replace petrol/diesel vehicles
Fuel Duty currently raises around £28 billion for HM Treasury each year. VAT on fuel raises somewhere around another £5 billion. As the proportion of electric vehicles in the UK rises, this revenue will be replaced by VAT on the electricity used to recharge them. If all vehicles today were electric, the VAT revenue would be less than £1 billion. By way of illustration, compensating for this reduction in revenue by an increase in Income Tax would require a rise in the basic rate from 20p to 27p in the pound.[44]
2. Fund more comprehensive and dependable public transport provision across the country
Funding for public transport, in particular bus services, is insufficient to provide the quality and capacity of service needed to be a viable and attractive alternative to driving for more than a small minority of the UK population. Public subsidy of public transport is entirely justified on grounds of net social benefit, which takes into account the non-monetised external costs of private transport and benefits of public transport. For bus services to offer the same level of dependability as railway or tram services, more and consistent funding must be provided to transport authorities. This will require additional tax revenues (as well as additional borrowing to fund capital investments).
3. Incentivise modal shift from solo-occupancy driving to active and public transport
Cars are a convenient but highly inefficient mode of transport for most trips. Per person-km, active and public transport require substantially less energy and manufactured materials, occupy less road-space, and emit less pollution and CO2. However, the marginal cost of driving (fuel and parking) is typically much lower per person-km than the marginal cost of public transport. For electric vehicles, the marginal cost is lower still – in some circumstances, less than a quarter that of an equivalent petrol or diesel vehicle. This not only strengthens the cost advantage of driving over public transport, it creates an incentive to drive more: to commute further and to make more and longer discretionary trips. This will consume more energy, generate more particulate emissions from tyre wear, and exacerbate road congestion.
The more specific objectives are therefore to:
- Reduce aggregate vehicle mileage so as to reduce energy consumption, carbon emissions, air pollution and congestion.
- Create new active, public and shared travel options for more people so as to improve public health and promote economic and social mobility.
- Reduce vehicle ownership by choice, reducing the embodied carbon of transport.
4. Incentivise more efficient and sustainable movement of freight
The largest growth in vehicle-miles in recent years has been in the freight sector, in particular last-mile deliveries of Internet orders. In the 25 years to 2019, the vehicle-mileage of light commercial vehicles increased 106%, whereas total vehicle-mileage increased just 36%.[45] This is largely as a result of growth in same-day (e.g. grocery) and next-day deliveries, the inefficiency of which is clear: multiple couriers call at different houses in the same street. Subscription services like Amazon Prime encourage people to order items for next-day delivery when this isn’t necessary, either because it’s not time critical or the buyer could easily have placed the order a day or more earlier.
To reverse this trend and reduce the associated emissions of carbon and pollutants, logistics companies need to change operating practices, and their customers need to make more efficient demands. Financial incentives, and possibly regulations, are needed to encourage logistics companies to co-operate to consolidate freight movements more efficiently; to share regional and local hubs; and make more use of smaller electric and human-powered vehicles for ‘first-mile’ collections and ‘last-mile’ deliveries.
It may also be necessary to impose a tax on inefficient practices, such as long-distance next-day delivery, to exaggerate the economic incentive for customers to plan ahead and consolidate orders.
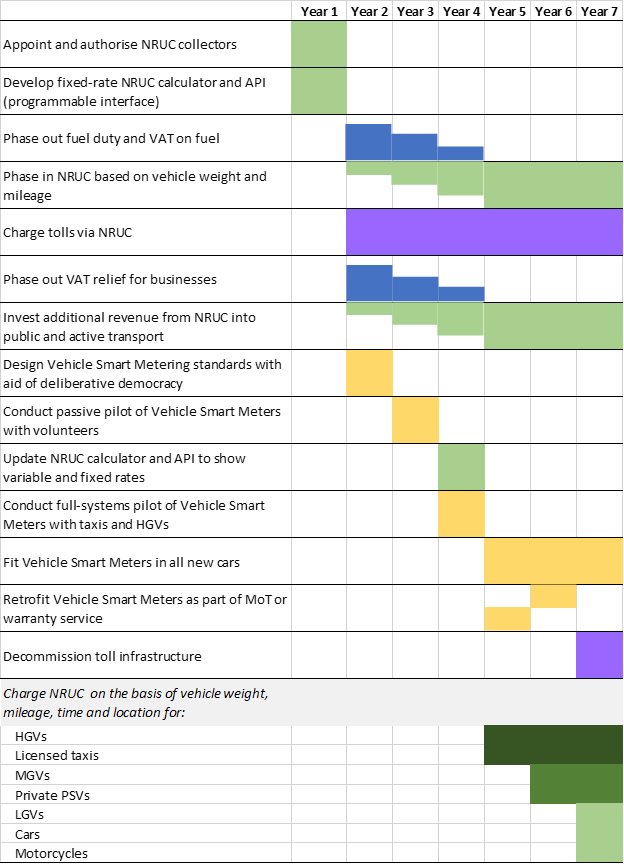
Outline solution
The road pricing solution proposed is designed to address each of the above objectives sequentially, rather than in parallel. This will create a simpler, more comprehensible narrative for the introduction of road pricing, and for each step in its development. Using deliberative democratic techniques, co-ordinated with public information campaigns, there is a good likelihood that government can gain widespread public acceptance and compliance, rather than relying on imposition and enforcement.
The working name for the road pricing charge is ‘National Road User Charge’ (NRUC). This is based on the principle that roads are a type of utility for which users should pay, just as for water or electricity. It avoids the term ‘tax’ which is negative.
Phasing implementation avoids many of the risks of ‘big bang’ IT projects (such as the NHS patient record system, Lorenzo, abandoned at a cost of £10bn[46]). The initial implementation, in phase 1, is simple and requires the minimum of infrastructure, admin and IT systems. The per-mile rate is based only on fixed characteristics of the vehicle. Phase 2 develops funding mechanisms to direct some NRUC revenue consistently to national and regional transport authorities, in part to invest in public transport. Phase 3 develops NRUC to be based on other factors, such as driving location and time, in order to start incentivising changes to personal and business transport choices.
What follows is an illustration of how NRUC might be implemented. The process of designing the scheme, in particular the use of citizens’ juries and assemblies, may arrive at something quite different.
Phase 1
Introduce road pricing as a simple like-for-like replacement for fuel duty
‘Like-for-like’ means both revenue-neutral to the Treasury and cost-neutral to the consumer. This may be achieved by setting the mileage rates to closely approximate fuel economy. Simplicity ensures the public message is easy to communicate, and avoids dependence on complex, bespoke IT system, failures of which would be a PR disaster. Managed well, most people’s reaction to the change should be neutral.
The only group that will not be able to avoid paying more than now are owners of EVs. As the running costs will still be substantially lower than for a petrol/diesel vehicle, this should not be a concern. Owners of electric vehicles today are almost exclusively in higher wealth and income brackets, and so should experience no hardship from paying more for driving. Any incentives needed to accelerate the transition from petrol/diesel to electric vehicles should continue to be applied to the vehicle purchase price and annual taxes.
Since people are used to paying fuel duty in a small instalment each time they fill up their vehicle, it will be important to give them the ability to pay NRUC in monthly instalments on a day of their choosing. The billing system will need to accept forecasts of expected mileage and issue refunds and demand balancing payments as actual mileage readings are submitted (as frequently as the vehicle owner likes – at a minimum, six-monthly). The system could operate in a similar way to Self-Assessment Income Tax payments, where underpayments require a balancing payment and interest; and overpayments earn interest.
Garages conducting MoTs already make an official record of odometer readings. These may be used to verify the validity of owner-supplied readings. For a car under three years old, owners would be required to take their car to an authorised garage at least annually to have an odometer reading taken. This may be coincide with a warranty service. This follows the pattern used by utility companies, which accept customer readings but also contract meter readers to take an official reading periodically.
Appoint Authorised NRUC Collectors
For reasons of personal privacy and system resilience, vehicle tracking data should probably be mediated by non-governmental organisations (e.g. insurers and vehicle manufacturers). These ‘Authorised NRUC Collectors’ calculate vehicle owners’ liabilities and handle billing. They make returns to HMRC, just as VAT-registered businesses do for VAT. They send summarised data to DVLA/HMRC, and anonymised data to ONS for statistical analysis. This ensures that government has only what it needs for reconciliation and audit purposes, and for managing and planning the road network. Access to personal travel data requires a court order.
In the first place, they will just be taking odometer readings, but some will be involved in piloting Vehicle Smart Meters (see below).
Develop NRUC calculator
A simple online calculator could show people what their expected annual NRUC liability will be, alongside an estimate of their current expenditure on fuel duty and VAT. The site could also accept submissions from people stating what their actual expenditure is, so that discrepancies in the proposed NRUC banding can be identified before the charge goes into effect.
It must be developed with an open API (programmable interface) so that journey planning apps can obtain trip costs. This will become important in Phase 3, when the mileage rate will vary by road and time of day.
Design Vehicle Smart Metering
Vehicle Smart Meters (VSMs) would be powered by the vehicle’s battery and use public data networks to transmit readings securely and reliably. The technology is already well established in the logistics sector, so it would mostly be a matter of developing systems and data standards and processes for the NRUC.
The specification for NRUC-compliancy will need to be transparent, widely understood and generally supported by the population. If opponents can depict VSMs as apparatus for “government spying,” it will make their introduction considerably more challenging.
Technical and expert input into the design must be complemented by deliberative democratic techniques, such as citizens’ juries and assemblies. These are designed to be more representative of the general public than focus groups, and yield more informed opinions than polls. Citizens are best placed to consider issues of:
- Social contracts, civil liberties and privacy: What does society gain? Which individuals gain and lose, and how? In what ways will vehicle tracking information be used, verified, stored, anonymised and erased?
- Sequencing: In what order must changes be made to create a coherent narrative and retain people’s trust?
- Public messaging: What is the simplest way to describe and explain the changes to be made?
There should be complete and open reporting of the terms of reference and evidence presented to citizens’ juries and assemblies; and of their conclusions and reasoning. Only the deliberations themselves should be private, to allow for frank discussion and testing of ideas.
Pilot Vehicle Smart Meters
Piloting of Vehicle Smart Meters will allow the designers to test and refine the agreed technical specifications for the meters, communication and back-end systems. That will test the resilience of the systems; data accuracy, integrity and security; and modelling of revenues. The pilot could be run in two phases:
1. Passive implementation
Pilot participants would have Vehicle Smart Meters installed in their vehicles, but would continue to pay NRUC at the standard fixed rate. This pilot would test the accuracy, security, reliability and resilience of tracking, communications and back-end systems. It would report to the user the theoretical NRUC rate they might expect to pay, which would be compared with the fixed-rate NRUC to identify divergences. Users may be asked what changes they would consider making if charged at the new rate to start to gauge and forecast effects.
Incentives to take part in trials include:
- Lower car insurance premiums for careful and low-mileage drivers (as already happens).
- No need to submit odometer readings manually.
- No missed readings or resulting penalties.
- Automated billing of bridge, tunnel and motorway tolls.
- More accurate NRUC bills, so no adjustments for under- or overpayments.
2. Full-systems testing
Once the systems are working reliably, and the initial charging rates set, one or more classes of vehicle owners would be selected to switch over from fixed-rate to variable-rate NRUC. Two classes of vehicles might be considered for this: HGVs and licensed taxis. In both cases, tracking technology is already in widespread use with clear commercial and social benefits. This approach would avoid the many difficulties and perceived unfairness of running a pilot in a geographically prescribed area.
Bill tolls and zone-based charges with NRUC
Significant cost-savings may be achieved by using NRUC to bill bridge and tunnel tolls, and charges to enter low emission and congestion charge zones. At this stage ANPR camera would still be needed to detect vehicles not involved in the Vehicle Smart Meter pilot. ANPR data would be transmitted to the vehicle’s Authorised NRUC Collector, which would add the toll to the appropriate NRUC account (after checking for duplicate toll records).
Phase 2
Increase the total revenue from NRUC to exceed that of fuel duty
If the £3.7 billion/year of fuel-VAT revenue[47] currently returned to businesses were instead used to support public, active and shared transport, it could be transformative. For example, the report by the Campaign for the Protection of Rural England and Transport for Quality of Life estimated that £2.7 billion/year would be enough to support a Swiss-style, comprehensive, integrated bus network for England.[48] The justification for this redirection of money from businesses to investment in transport is that businesses will benefit from:
- reduced congestion, as people shift from driving to other transport modes, leading to reduced costs of delivering goods and service;
- an enlarged pool of potential employees who do not have access to a car;
- a reduced carbon footprint from employees commuting by public transport instead of car.
Businesses are used to adjusting their products/services and prices to variations in input costs; given sufficient notice and tapering (by phasing the replacement of fuel duty with NRUC over a number of years), increased driving costs will not cause undue disruption, any more than do normal fuel price fluctuations.
The justification for raising additional revenue must be explained to the public in clear and honest terms. It is about building an environmentally sustainable and socially equitable future. It’s a transfer of money from a mode of transport that makes inefficient use of public road infrastructure, causes damage to the environment and people’s health, and excludes a significant proportion of the population who cannot drive or cannot afford to drive. The beneficiaries will be the growing number of users of active, public and shared transport options, which make efficient use of public infrastructure at a low environmental cost, and which provide social and health benefits to a wider range of the population, in terms of age, physical and mental abilities and wealth.
If the £3.7 billion/year of VAT revenue[49] currently returned to businesses were instead used to support public, active and shared transport, it could be transformative. For example, the report by the Campaign for the Protection of Rural England and Transport for Quality of Life estimated that £2.7 billion/year would be enough to support a Swiss-style, comprehensive, integrated bus network for England.[50]
Refine mileage rates
Although initially per-mile rates would be set to mimic the cost of fuel duty, rates should evolve to take better account of external costs and benefits. For instance, the weight of a vehicle determines more than just its fuel consumption: the damage to roads and adjacent buildings increases with the fourth power of the axle weight.[51] The design of a vehicle can cause dramatically different severities of injury in the event of a collision. These additional external costs should be reflected in those vehicles’ per-mile rates.
Hypothecate portions of NRUC to national and local highway authorities
Devise mechanisms for portions of NRUC revenue to be channelled directly to transport authorities to fund the management and maintenance of highways (roads, footways and cycle tracks), subsidies for public transport, and future investment.
Work should also start on designing and implementing mechanisms by which regional transport authorities may set NRUC premiums at a local level in Phase 3, with the additional revenue channelled back to them.
Install Vehicle Smart Meters in all vehicles
Once specifications have been finalised, meters can be manufactured and installed in all vehicles in readiness for Phase 3.
Phase 3
Expand the scope of NRUC to track driving location and time
This is the most challenging and complex phase, as its aims are to shift incentives away from solo-occupancy driving towards active, public and shared transport, and to incentivise more efficient movement of freight.
It needs to be implemented in an equitable way, which is not the same as maintaining the status quo. Change must be directed by clear and democratically agreed objectives. Technology must be employed to serve not determine or constrain those objectives.
It is important for public messaging to make clear that external costs are real, and that NRUC will be redress unfairnesses with current vehicle taxation. It must acknowledge at an early stage that some people will pay more to drive and explain why.
Update NRUC calculator
The online NRUC calculator developed in Phase 1 would give people an accurate prediction of trip costs. The API ensures this information can be provided through any journey planning app. This will allow people to plan their route and time of travel to minimise the cost, if that is important to them.
Hypothecate portions of NRUC to regional transport authorities
Enable regional transport authorities to set variable premiums on NRUC for travelling on specific roads at certain times. This would permit transport authorities to incentivise vehicle drivers to change their mode or time of travel or route to reduce congestion and pollution. The money raised is channelled back to the relevant transport authorities to fund subsidies for public transport, and other investment in active and public transport.
Decommission tolls and zone-based infrastructure
Tolls and zone-based charges, already billed via the NRUC, can now be triggered when the Vehicle Smart Meter records that it has crossed a virtual toll gate or entered a charging zone. Therefore, the road-side vehicle detection equipment can be decommissioned, saving maintenance and renewal costs.
Conclusion
The climate emergency and rapidly approaching tipping point in the sales of new electric vehicles necessitate urgent action from the government. Road pricing is the only mechanism available that can both raise revenue and alter transport behaviours to reduce vehicle-miles.
The design and implementation of a National Road User Charge (NRUC) described here illustrates a practical way in which to introduce road pricing quickly and with minimal risk. It would replace and supplement fuel duty as a government revenue stream. It would radically overhaul how transport infrastructure and services are funded. And it would provide a sophisticated tool for influencing people’s transport choices.
However, in order to gain popular acceptance and compliance, the government should draw on deliberative democratic techniques, such as citizens’ juries and assemblies, co-ordinated with public information campaigns, to agree the principles, objectives and practicalities of the road pricing system it implements.
Illustrative timetable
Statistics
Figures relate to 2019 or 2018–19 unless stated otherwise.
Table 1: Tax revenue to HMRC (UK)
|
Fuel duty (DfT reporting)[52] |
£27.2 billion |
|
VAT on fuel (see Table 9) |
£10.1 billion |
|
VAT reclaimed by businesses (see Table 9) |
– £3.7 billion |
|
Vehicle Excise Duty[53] |
£7.0 billion |
|
HGV Road User Levy[54] |
£0.2 billion |
|
Bus Service Operators Grant (BSOG)[55] |
-£0.2 billion |
|
Total |
£40.6 billion |
Table 2: Summary of transitional tax revenues
|
|
Personal |
Business |
Total |
|
Current consumption of petrol and diesel |
|||
|
Duty paid |
£17.42 billion |
£9.76 billion |
£27.19 billion |
|
VAT paid @ 20% |
£6.41 billion |
£3.70 billion |
£10.11 billion |
|
VAT refunded |
£0 |
– £3.70 billion |
– £3.70 billion |
|
Subtotal |
£23.83 billion |
£9.76 billion |
£33.60 billion |
|
Equivalent consumption of electricity |
|||
|
Climate Change Levy78 |
£0.70 billion |
£0.43 billion |
£1.13 billion |
|
VAT paid @ 5% at average standard unit rate |
£0.71 billion |
£0.43 billion |
£1.14 billion |
|
VAT refunded |
|
– £0.43 billion |
– £0.43 billion |
|
Subtotal |
£1.41 billion |
£0.43 billion |
£1.84 billion |
|
Net difference |
– £22.42 billion |
– £9.33 billion |
– £31.76 billion |
Table 3: Cost breakdown of a litre of fuel in 2019[56]
|
|
Petrol |
Percentage |
|
Diesel |
Percentage |
|
Pre-tax price |
£0.4619 |
37.0% |
|
£0.5181 |
39.3% |
|
Duty |
£0.5795 |
46.4% |
|
£0.5795 |
44.0% |
|
VAT @20% |
£0.2083 |
16.7% |
|
£0.2195 |
16.7% |
|
Pump price |
£1.2497 |
100.0% |
|
£1.3171 |
100.0% |
Table 4: Government expenditure on roads[57]
|
National roads |
£4.8 billion |
|
Local roads |
£5.3 billion |
|
Total |
£10.1 billion |
Table 5: Cost of road traffic casualties[58]
|
Medical & ambulance |
£1.7 billion |
|
Policing |
£0.2 billion |
|
Insurance & damage to property |
£6.0 billion |
|
Lost output |
£4.4 billion |
|
Human costs (subjective) |
£21.2 billion |
|
Total |
£33.5 billion |
Table 6: Annual environmental and public health costs
|
£8.1 billion |
|
|
Health impacts of air pollution[61] |
£6 billion |
|
Health impacts of inactivity[62] |
£0.5 billion |
|
Health and economic impacts of social isolation |
unknown |
|
Biodiversity loss from new/expanded roads |
unknown |
|
Total |
£14.6+ billion |
Table 7: Vehicles (Great Britain)
|
|
Licensed[63] |
Total distance driven[64] |
Average distance driven |
|
Cars and taxis |
33.69 million |
447.8 billion km |
13,293 km/year |
|
Light vans |
4.25 million |
89.4 billion km |
21,054 km/year |
|
Heavy goods vehicles |
0.53 million |
28.0 billion km |
53,252 km/year |
|
Buses and coaches |
0.16 million |
3.9 billion km |
30,476 km/year |
|
Motorcycles |
1.27 million |
4.8 billion km |
3,063 km/year |
|
All vehicles |
39.89 million |
573.8 billion km |
14,384 km/year |
Table 8: Fuel consumption (UK)[65]
|
|
Petrol |
Diesel |
||
|
|
million tonnes |
billion litres |
million tonnes |
billion litres |
|
Cars and taxis |
11.3 |
15.23 |
10.7 |
12.69 |
|
Light vans |
0.2 |
0.27 |
5.8 |
6.88 |
|
Heavy goods vehicles |
|
|
6.3 |
7.47 |
|
Buses and coaches |
|
|
1.0 |
1.19 |
|
Motorcycles |
0.2 |
0.27 |
|
|
|
All vehicles |
11.7 |
15.77 |
23.8 |
28.23 |
Table 9: Estimated personal/business split
See Tables 7, 8, 11, 12 for sources for these figures.
|
|
Personal |
Business |
||
|
Vehicle types |
Cars & motorcycles |
Other vehicles |
||
|
Licensed vehicles |
33.91 million |
87.7% |
4.77 million |
12.3% |
|
Total distance driven |
452.6 billion km |
78.9% |
121.3 billion km |
21.1% |
|
Average distance driven |
13,347 km |
|
25,430 km |
|
|
Petrol consumption |
15.50 billion litres |
98.3% |
0.27 billion litres |
1.7% |
|
Diesel consumption |
12.69 billion litres |
45.0% |
15.54 billion litres |
55.0% |
|
Total petrol/diesel consumption |
28.19 billion litres |
64.1% |
15.81 billion litres |
35.9% |
|
Equivalent electricity for petrol[66] |
46.50 billion kWh |
98.3% |
0.81 billion kWh |
1.7% |
|
Equivalent electricity for diesel66 |
44.42 billion kWh |
45.0% |
54.39 billion kWh |
55.0% |
|
Total equivalent electricity |
90.92 billion kWh |
62.2% |
55.20 billion kWh |
37.8% |
Table 10: Historical comparison of vehicle-mileage64
|
|
Year 1994 |
Year 2019 |
Increase |
|
Cars and taxis |
345.0 |
447.8 |
29.8% |
|
Light vans |
43.3 |
89.4 |
106.5% |
|
Heavy goods vehicles |
24.8 |
28 |
12.9% |
|
Buses and coaches |
4.6 |
4.8 |
4.3% |
|
Motorcycles |
3.8 |
3.9 |
2.6% |
|
All vehicles |
421.5 |
573.8 |
36.1% |
Table 11: Fuel
|
Unit cost of petrol (inc VAT) 8 February 2021[67] |
£1.1967/litre |
|
Unit cost of diesel (inc VAT) 8 February 202167 |
£1.2409/litre |
|
Fuel duty (ex VAT)[68] |
£0.5795/litre |
|
Bus Service Operators Grant fuel duty rebate (diesel)[69] |
£0.3457/litre |
|
VAT rate on fuel |
20% |
|
Density of petrol[70] |
1,348 litres/tonne |
|
Density of diesel70 |
1,186 litres/tonne |
Table 12: Fuel/energy economy of vehicles
|
Average fuel economy of petrol car[71] |
5.8 litres/100km |
|
Average fuel economy of diesel car71 |
5.0 litres/100km |
|
Average fuel economy of diesel LGV[72] |
6.7 litres/100km |
|
Average fuel economy of HGV[73] |
30.4 litres/100km |
|
Conversion rate of 1 mpg (imperial) |
282.481 litres/100km |
|
Equivalent economy of electric power to petrol fuel[74] |
3.0 kWh/litre |
|
Equivalent economy to electric power to diesel fuel74 |
3.5 kWh/litre |
Table 13: Electricity
|
UK electricity supplied in 2019[75] |
346 TWh |
|
Electricity required if all current mileage is by EVs (see Table 9) |
236 TWh |
|
Standard unit cost of electricity in 2020 (inc VAT)[76] |
£0.172/kWh |
|
Economy 7 unit cost of electricity in 2020 (inc VAT)76 |
£0.100/kWh |
|
Ecotricity rapid-charge cost (inc VAT)[77] |
£0.300/kWh |
|
VAT rate on electricity |
5% |
|
Climate Change Levy on electricity[78] |
£0.00775/kWh |
Table 14: Breakdown of electricity unit cost
|
Standard unit cost of electricity (ex VAT)[79] |
15.606p |
90.7% |
|
Climate Change Levy on electricity78 |
0.775p |
4.5% |
|
VAT @ 5% |
0.819p |
4.8% |
|
Domestic end user cost |
17.2p |
100% |
Table 15: Energy consumption and carbon emissions by sector
|
|
Energy (MtOe)75 |
Carbon emissions (MtCO2e)[80] |
||||
|
|
|
Inc energy industry |
Exc energy industry |
|
Inc energy industry |
Exc energy industry |
|
Energy industry |
47.9 |
25.2% |
|
95.8 |
21.1% |
|
|
Other industry |
22.3 |
11.7% |
15.7% |
10.4 |
2.3% |
2.9% |
|
Other business |
14.6 |
7.7% |
10.3% |
77.9 |
17.1% |
21.7% |
|
Domestic |
41.3 |
21.7% |
29.1% |
69.2 |
15.2% |
19.3% |
|
Public sector (inc waste management) |
5.6 |
2.9% |
3.9% |
26.9 |
5.9% |
7.5% |
|
Agriculture & forestry |
1.5 |
0.8% |
1.1% |
52.3 |
11.5% |
14.6% |
|
Road transport |
40.9 |
21.5% |
28.8% |
110.7 |
24.3% |
30.8% |
|
Other transport |
15.8 |
8.3% |
11.1% |
11.5 |
2.5% |
3.2% |
|
Total |
189.9 |
|
|
454.8 |
|
|
Table 16: Income Tax
|
Revenue per additional penny on the basic rate of Income Tax[81] |
£4.45 billion |
[1] Paris Agreement between 196 countries, including the UK, effective 4 November 2016
[2] Climate Change Act 2008 (as amended in 2019)
[3] IPCC Special Report on Global Warming of 1.5°C
[4] Carbon budgets: where are we now? (Axel Dalman, Carbon Tracker, 11 May 2020)
[5] See Table 15
[6] See graph of camera sales produced by PetaPixel.
[7] Norway is reaching tipping point for electric vehicles as market share reaches record breaking 37% (electrek, 2017)
[8] Norway becomes first country where electric vehicle sales exceeded 50% of car trade in 2020 (euronews, 2021)
[9] Four major cities move to ban diesel vehicles by 2025 (BBC News, 2 December 2016)
[10] See Table 2.
[11] See Table 12.
[12] See Table 12 and Table 13.
[13] See Table 13.
[14] See Table 13.
[15] See Energy Storage Association’s round-up of storage technologies.
[16] Octopus Agile rate price chart.
[17] Smart meters in Great Britain, quarterly update September 2020 (DBEIS, 2020)
[18] See Table 5.
[19] See Table 6.
[20] See Table 1.
[21] See Table 4.
[22] The Growth of App-Based Ride Services and Traffic, Travel and the Future of New York City (February 2017) by Schaller Consulting.
[23] Bus ridership figures from MTA (Metropolitan Transportation Authority) New York City
[24] Impacts of transportation network companies on urban mobility, Mid Diao, Hui Kong & Jinhua Zhao, Nature Sustainability 2021
[25] Chancellor announces support for motorists, HM Treasury, June 2012
[26] See Table 9.
[27] See Table 13.
[28] Highways Agency FOI request CRS716,964
[29] Cambridge to Huntingdon A14 Improvement Scheme Consultation Report December 2013
[30] Highways England AADF traffic counts #80832 and #36023
[31] Transport for London Congestion Charge
[32] Durham Peninsula charging zone
[33] Transport for London Ultra Low Emissions Zone
[34] Swedish Transport Agency congestion tax
[35] Singapore Electronic Road Pricing
[36] Road Pricing: The Economic and Technical Possibilities (1964) by R J Smeed
[37] See D’Artagnan Consulting article on Singapore will have world’s first GNSS urban congestion pricing scheme by 2020.
[38] Global Navigation Satellite System, which encompasses GPS, Galileo and other satellite systems – see Wikipedia article.
[39] Oregon’s Road Usage Charge Program, Oregon state government
[40] How do electric vehicle owners benefit by paying a road usage charge? Oregon Department of Transportation
[41] Table of tariffs for the HGV toll in Germany
[43] Road pricing: timely or toxic? (Ben Marshall, Ipsos MORI, 21 December 2020)
[44] See Table 16.
[45] See Table 10.
[46] NHS IT system one of ‘worst fiascos ever’, say MPs (BBC News, 18 September 2013)
[47] See Table 9.
[48] Every village, every hour: a comprehensive bus network for rural England (C Hinchliff and I Taylor, Transport for Quality of Life and CPRE, 2021)
[49] See Table 9.
[50] Every village, every hour: a comprehensive bus network for rural England (C Hinchliff and I Taylor, Transport for Quality of Life and CPRE, 2021)
[51] How Much Damage Do Heavy Trucks Do to Our Roads? (Yuen Yiu, Inside Science, 2020)
[52] Table TSGB1310: Fuel duty and vehicle excise duty from 1987, 2019 (DfT, 2020). This DfT figure does not tally with the DBEIS reported number of tonnes of petrol and diesel sold (see Table 8), which implies a duty revenue of £25.50 billion on 44 billion litres of petrol and diesel, not including £16m road fuel gases.
[53] Fuel duty and vehicle excise duty from 1987 (DfT TSGB1310, 2019)
[54] Road taxation revenue in the UK 2018–19 table TSGB1311 (list of tables published by DfT).
[55] Bus Service Operators Grant payments to English operators from 2010 onwards (DfT, 2020)
[56] Weekly road fuel prices 2019 (DBEIS, 2021)
[57] Public expenditure on transport by function 2018–19 (DfT TSGB1303, 2020)
[58] Total value of prevention of reported accidents by severity and cost element: Great Britain 2019 (DfT RAS60003, 2020)
[59] Atmospheric emissions: road transport (2018, ONS)
[60] Non-traded carbon price (2020, Table 3, BEIS)
[61] The health costs of air pollution from cars and vans (Dr Christian Brand, Dr Alistair Hunt, 2018)
[62] Physical inactivity: economic costs to NHS clinical commissioning groups (Dr Nick Townsend and Dr Charlie Foster, 2016)
[63] Vehicles licensed at Q4 2019. ‘Other vehicles’ has been added to cars & taxis as it includes hackney carriages (as well as a relatively small number of agricultural, construction, and other types of vehicles): DfT Table VEH0101 (all tables)
[64] Annual road traffic by vehicle type in Great Britain, 2019 (TRA0201, DfT, 2020)
[65] Digest of UK Energy Statistics (DUKES) Chapter 3, Table 3B (DBEIS, 2020)
[66] See Table 12
[67] Weekly Road Fuel Prices (BEIS, 2021)
[68] HMRC Excise Duty – Hydrocarbon oils rates
[69] Bus Service Operator Grant rates as of 1 April 2014 (all documents)
[70] Digest of UK Energy Statistics (DUKES) (DBEIS, 2020), Table A.4
[71] Average 2009–19 (from ENV0103, Department for Transport,2020)
[72] Average 2012–19 (from ENV0103, Department for Transport,2020)
[73] Average of all rigid vehicles 2003–16 (from ENV014, DfT, 2017)
[74] Based on real-world economy of Ford Focus Electric, Ford Focus 1.0 Ecoboost 100 and Ford Focus 1.5 TDCi 120
[75] Digest of UK Energy Statistics (DUKES) (DBEIS, 2020)
[76] Average variable unit costs and fixed costs for electricity for UK regions (from QEP 2.2.4, BEIS, 2021)
[77] Ecotricity (2021)
[78] Climate Change Levy from 1 April 2021
[79] Average variable unit costs and fixed costs for electricity for UK regions (from QEP 2.2.4, BEIS, 2021)
[80] Estimated territorial greenhouse gas emissions by source category, Table 1.2, 2019 (DBEIS, 2021)
[81] Direct effects of illustrative tax changes bulletin (Office of Statistics, 2021)
Leave a Reply